# Histogram
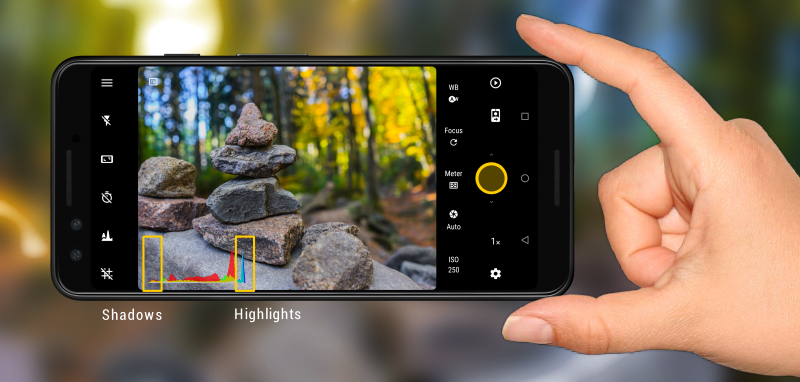
The histogram is a powerful guide to evaluate a photo exposure.
A histogram is a graph that counts how many occurrences of a particular brightness channel has. In case of color photos, there are three color channels (red, green and blue) each with its own intensities, whereas in black and white images there’s only one luminance channel. Also, even with color images, you can opt to get a luminance-only histogram. Internally, the picture is converted to grayscale to calculate the histogram.
# Activating the live histogram
Go to Settings > Viewfinder > Live histogram and activate Show histogram. The histogram is calculated in real time and changes when you move the camera or the subject, or you change settings that affect the lightning or color distribution.
# Histogram types
In Settings > Viewfinder > Live histogram > Histogram type you can select:
- RGB (3 color channels). This option is only available when taking color photos.
- Luminance. This option is also available when taking color photos. It shows the luminance histogram of the viewfinder converted to grayscale.
- Stacked RGB. This option displays an histogram similar to RGB, but the three histograms are merged together into one, making it more compact but still displaying the same information. This is the default mode.
Furthermore, you can adjust the size of the graphs in Histogram size (Normal and Mini) and the style of the histogram in Histogram style (Transparent or Solid).